Year end 2017 international and 1st Quarter 2018 domestic load factors and passenger numbers by route calculated. UA's MSY-DEN had the highest load factor in March at 93.3%, and NK's MSY-CLE had the lowest load factor at 67.1%. Through the 1st quarter...WN's MSY-DEN had the highest load factor at 92.6%, and NK's MSY-BOS had the lowest load factor at 61.3%.
Some new routes started. NK to CMH and WN to CLE, BOS, SMF.
Routes of interest:
Domestic (March 2018)
SFO (VX/AS) = Mar. load factor of 83.4%...Q1 of 77.7%
SFO (UA) = Mar. load factor of 81%...Q1 of 82.6%
CLE (NK) = Mar. load factor of 67.1%...Q1 of 63.8%
CLE (WN) = Mar. load factor of 78.8%
CLE (G4) = Mar. load factor of 79.6%...Q1 of 77.3%
BOS (NK) = Mar. load factor of 84.7%...Q1 of 61.3%
BOS (WN) = Mar. load factor of 89.1%
BOS (DL) = Mar. load factor of 82.6%...Q1 of 80.1%
BOS (B6) = Mar. load factor of 89%...Q1 of 82.5%
TPA (NK) = Mar. load factor of 80.9%...Q1 of 70.1%
TPA (WN) = Mar. load factor of 77.1%...Q1 of 70.1%
PIE (G4) = Mar. load factor of 76.1%...Q1 of 66.6%
CMH (NK) = Mar. load factor of 72.2%
CMH (WN) = Mar. load factor of 75.6%...Q1 of 70.5%
LCK (G4) = Mar. load factor of 76.1%...Q1 of 70.2%
PIT (WN) = Mar. load factor of 80.2%...Q1 of 73.2%
PIT (G4) = Mar. load factor of 86.3%...Q1 of 78.7%
IND (WN) = Mar. load factor of 81.3%...Q1 of 74.7%
IND (G4) = Mar. load factor of 86.1%...Q1 of 76.2%
RDU (WN) = Mar. load factor of 85.6%...Q1 of 73.7%
RDU (G4) = Mar. load factor of 87.1%...Q1 of 75.9%
SEA (AS) = Mar. load factor of 92.7%...Q1 of 90.2%
SEA (DL) = Mar. load factor of 87.3%...Q1 of 89%
SMF (WN) = Mar. load factor of 72.8%.
International (December 2017)
LHR (BA) = Dec. load factor of 73.4%...Annual of 76.7%
PTY (CM) = Dec. load factor of 80.8%...Annual of 77%
YYZ (AC) = Dec. load factor of 66.9%...Annual of 81.9%
CUN (DL) = Dec. load factor of 80.7%...Annual of 73.9%
Domestic
https://docs.google.com/spreadsheets/d/ ... sp=sharingInternational
https://docs.google.com/spreadsheets/d/ ... sp=sharing
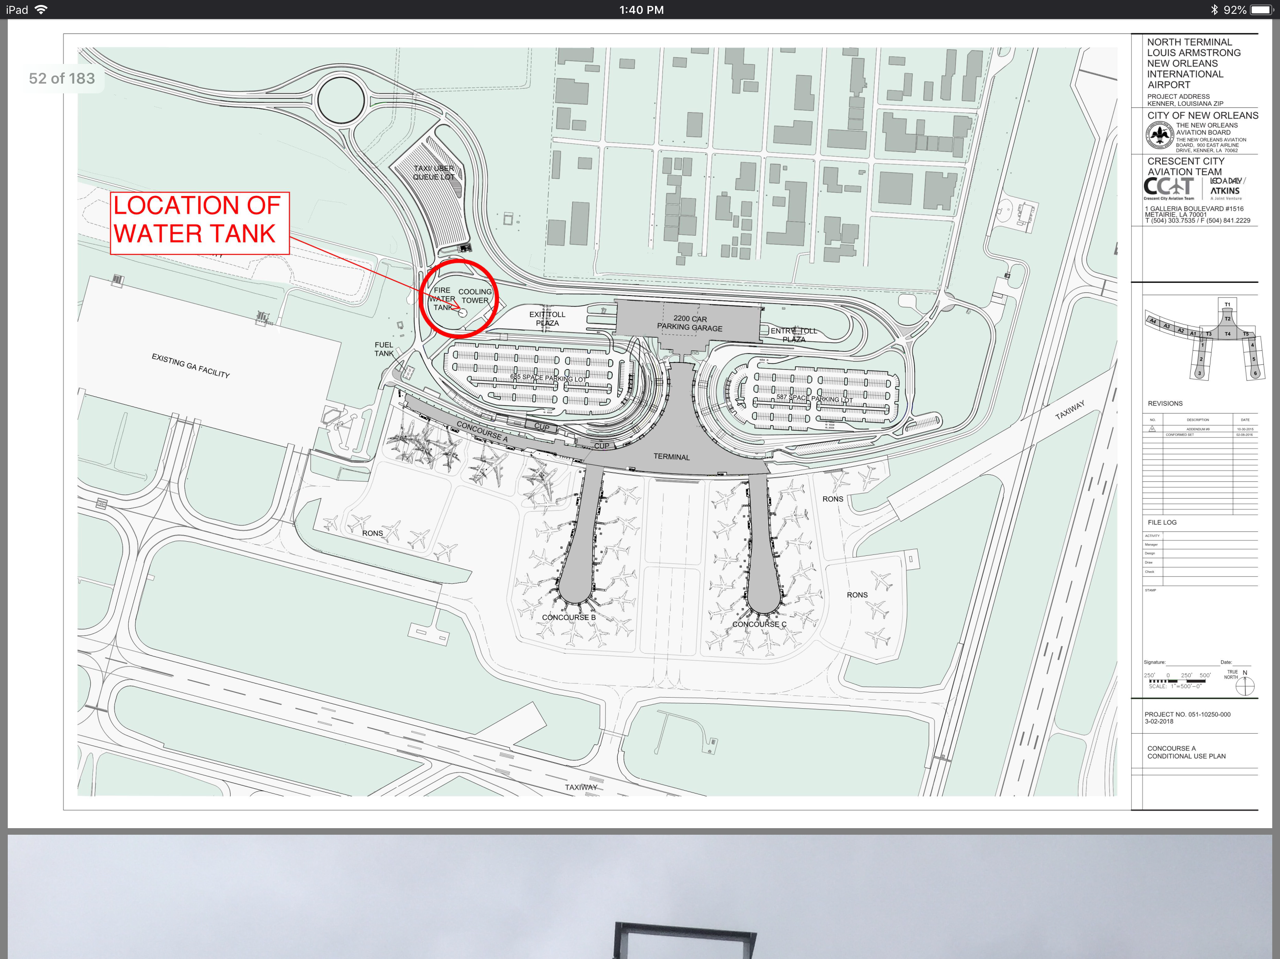
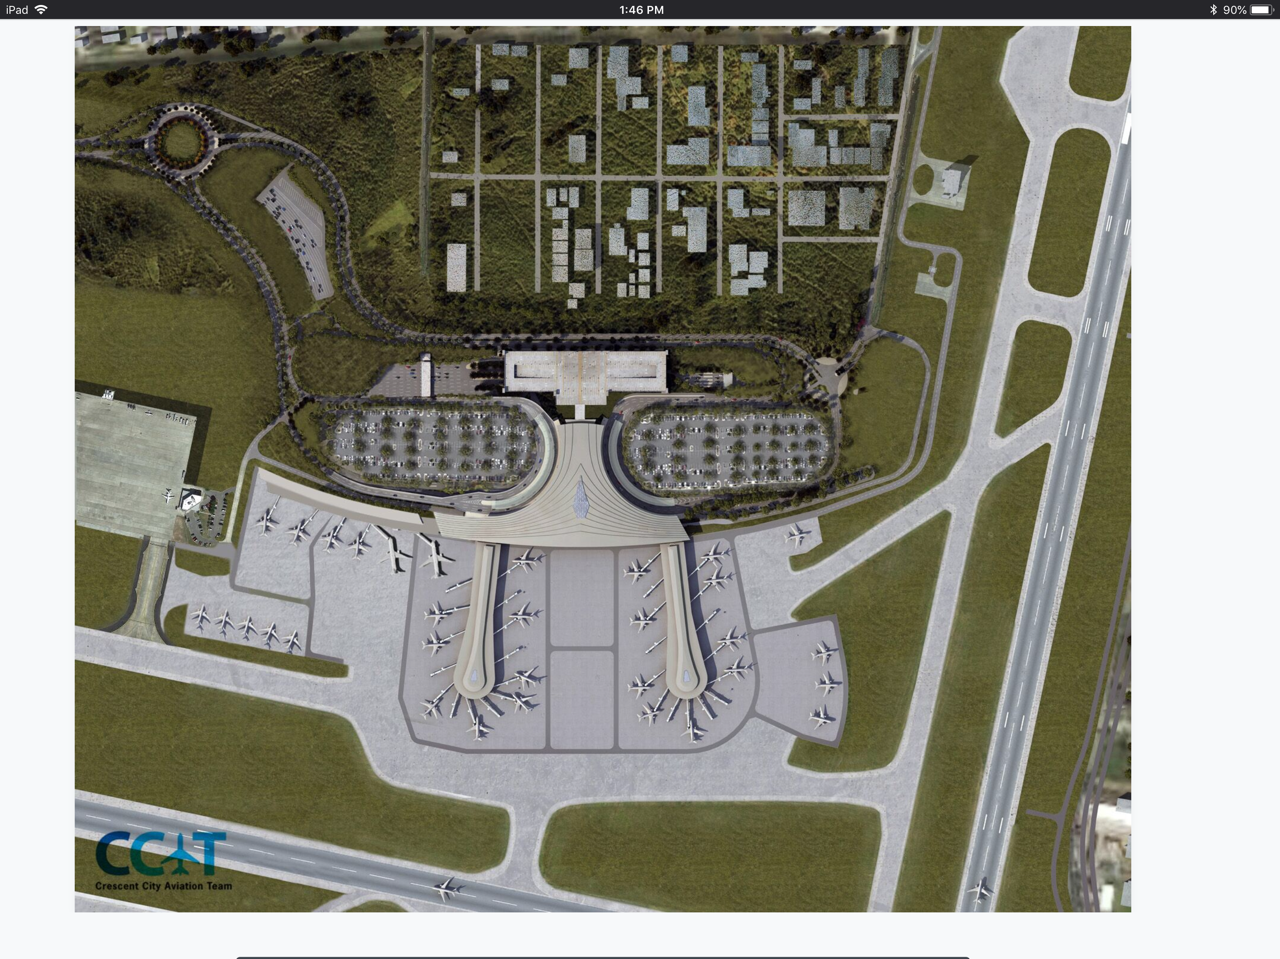
The airport owns 29 of the 35 existing bridges.